About the trainer
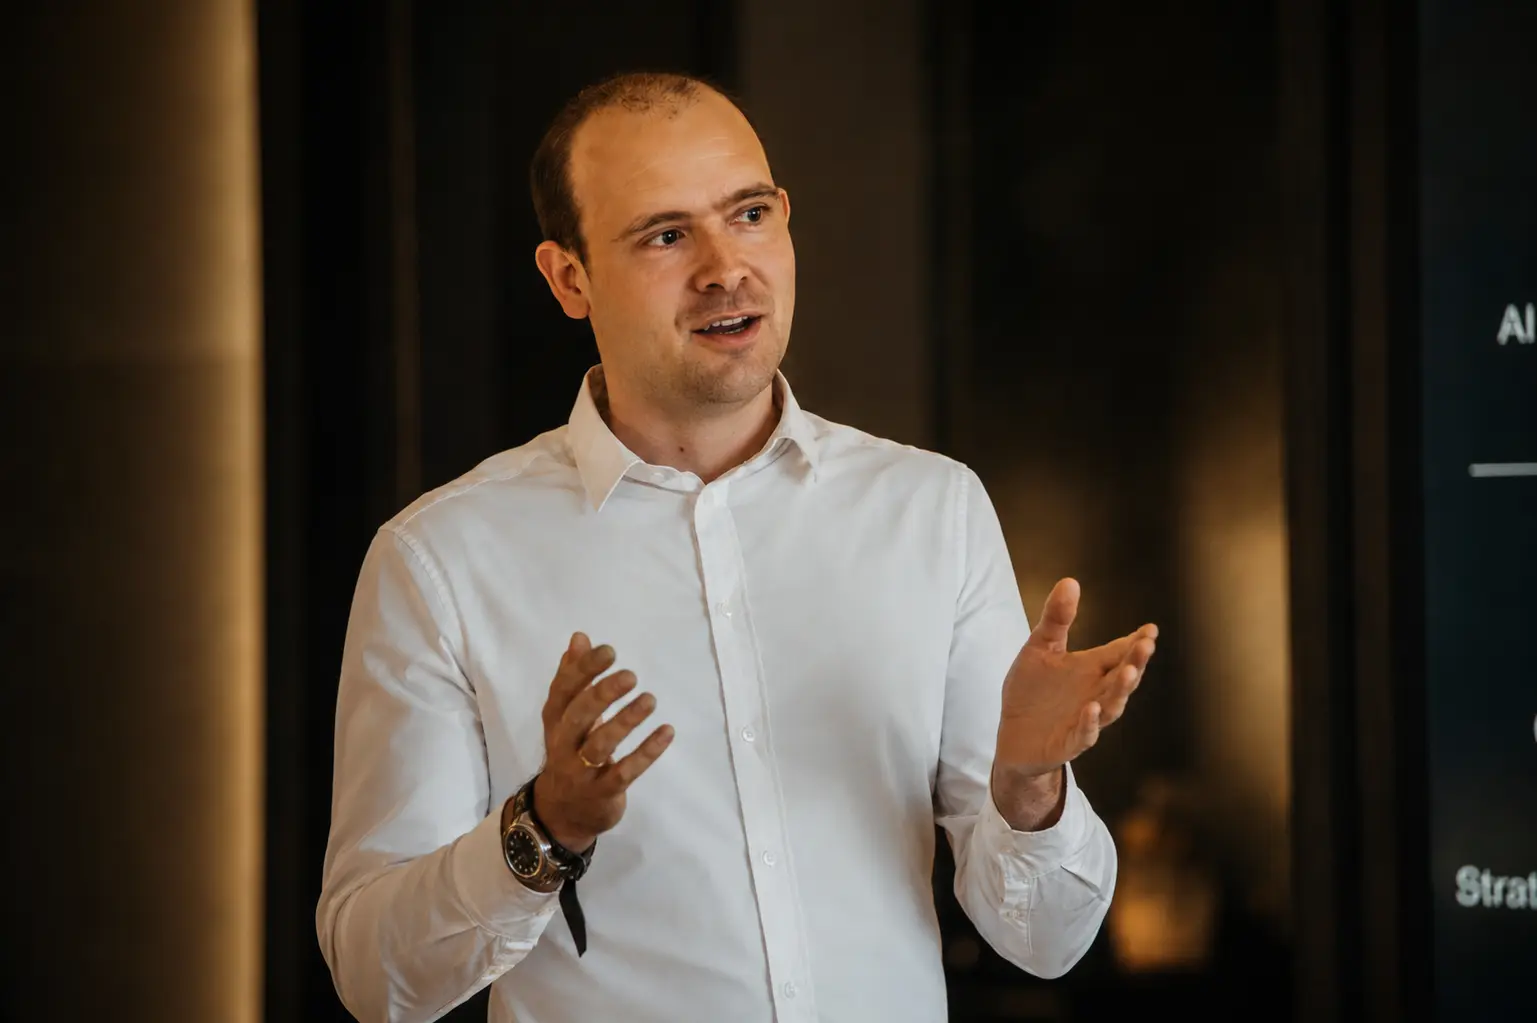
Bram is a digital strategy consultant and interim director with over 15 years of experience in digital transformation - ranging from predictive modelling and advanced process control to enterprise digital transformations with a strong focus on manufacturing. He has started and led data-platform and Factory-of-the-Future initiatives across industrial sites, working across the full stack from shopfloor sensors to boardroom business cases.
More about Bram: bram.vangenabet.com →Why this training
I want to share what I have learned from running UNS and data-platform initiatives in practice - what worked well, what did not, and the moments where I would do things differently with hindsight. That means honest field stories alongside the guidance, not just the polished version.
My goal is to bring this together as a practical playbook for getting started with a UNS - a repeatable, phase-by-phase approach that maximises the chances of delivering real business value, not just deploying technology. Every phase is grounded in practical examples from real implementations.
A UNS is a concept, not something you buy. I want to explain what it means in practice and give you something you can pick up and apply directly - whether you are starting from zero or trying to bring structure to a landscape that has already grown messy.
By the end of this training, you will:
- →Have a clear understanding of what UNS is, and what it is not
- →See how UNS relates to ISA-95 and the Purdue model
- →Understand the core principles for defining a naming convention
- →Know how to get started with a practical five-phase roadmap
- →Gain real-world insights into what worked well, and what didn’t in practice, including the pitfalls to watch out for
- →Learn the key considerations for building a solid business case
- →Apply guidelines for scaling value across multiple sites and the wider enterprise
UNS in 90 seconds
- ✓A UNS is a real-time single source of truth for your industrial business - a snapshot of the full manufacturing enterprise at any given moment, provisioned by the publishers and available to be consumed anywhere. The MQTT broker is one component of it, not the whole thing. Buying a broker does not give you a UNS any more than buying bricks gives you a house.
- ✓Producers publish once; any authorised consumer subscribes to what it needs, from PLC to ERP to analytics. Adding a consumer becomes a subscription, not a new integration.
- ✓It does not replace ISA-95. The control path stays direct (PLC to SCADA/DCS); the data path becomes shared. The Purdue model and IEC 62443 remain the cybersecurity backbone; ISA-95 is the integration backbone.
The problem it solves
As more and more systems were added at the interface between IT and OT, the number of point-to-point connections kept growing. Each new system had to be wired directly into the others. At the base sits the PLC / SCADA / HMI layer, with an MES interfacing on top of it, a historian capturing process data, and increasingly a set of separate IoT interfaces running alongside.
Over time this produces a dense web of direct links, each one needing to be built, monitored and maintained. This is what is often called spaghettification: as the number of interconnections grows, so does the load on every connected system, while changes become harder to make and overall maintainability suffers.
- ✗Duplicate pipelines and redundant load
- ✗Data silos with no shared truth
- ✗Diverging reports from different copies
- ✗Uncontrolled cyber exposure
- ✗Growing integration maintenance burden
.svg)
The roadmap
Start small. Prove value. Then scale. No big bang. The rest of this training walks each phase in order. Use the bar at the top to jump to any phase.
Phase 1
Value Assessment
Know the size of the prize
Phase 2
Standardise
Fix the foundation first
Phase 3
Gap-Fit
Best of breed, no big bang
Phase 4
Pilots
Now the clock is ticking
Phase 5
Roll Out
Where the UNS earns its keep
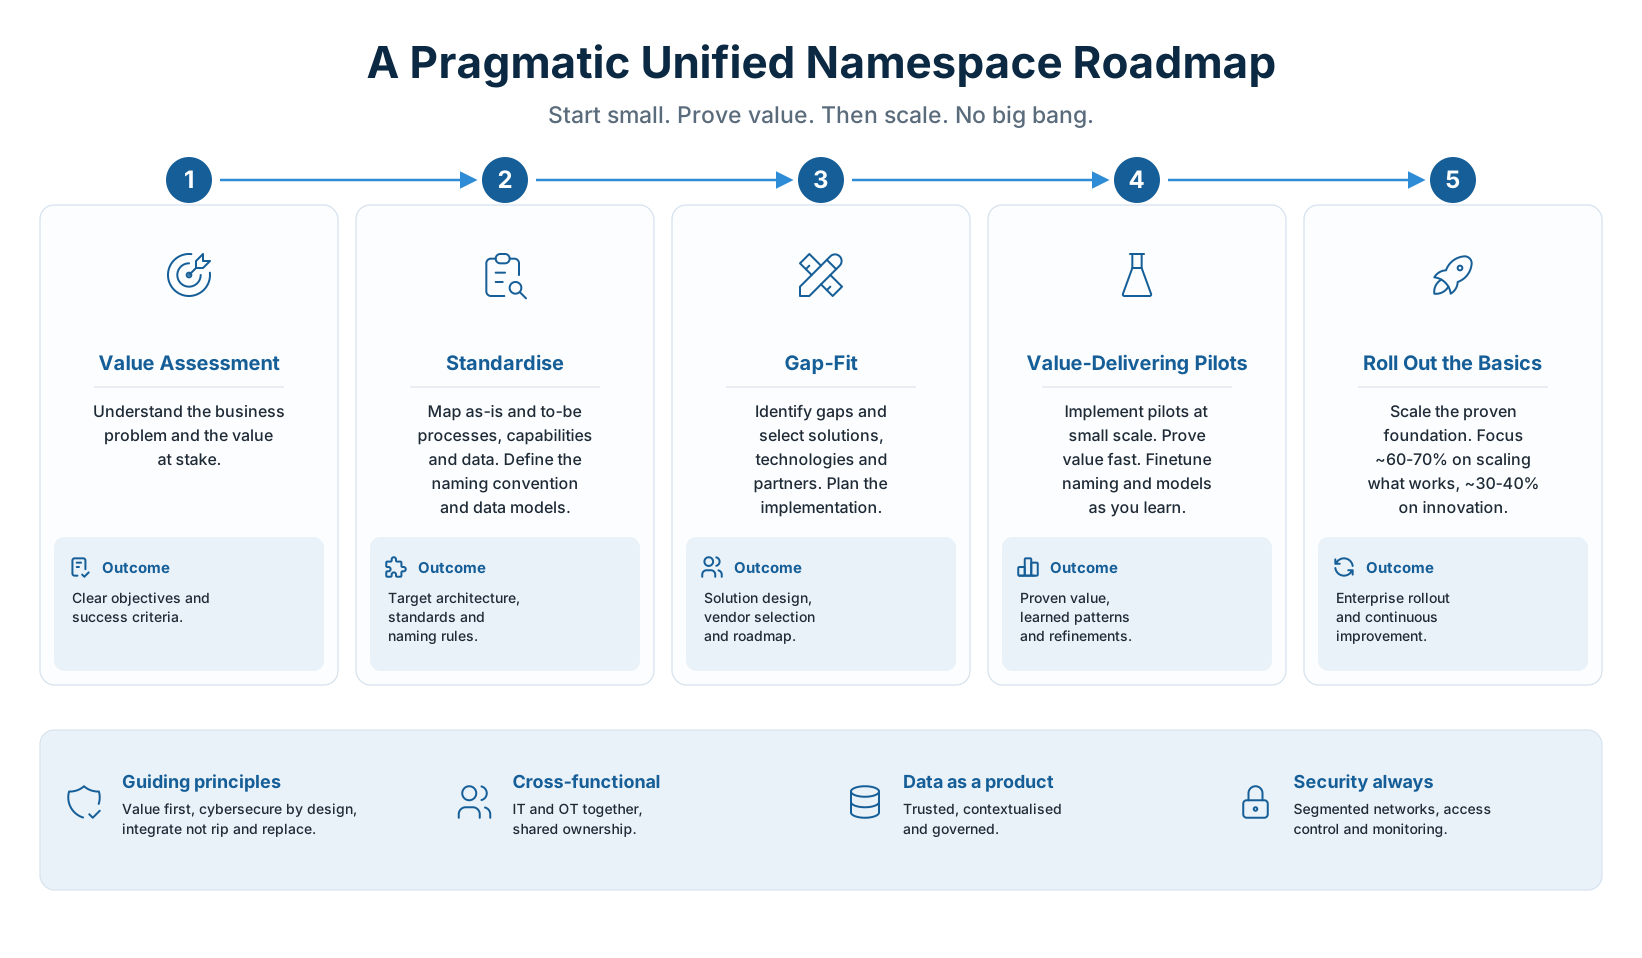
This diagram outlines a pragmatic approach to implementing a Unified Namespace, highlighting the main steps and phases involved.
Phase 1 of 5
Value Assessment
Never start a project without knowing the size of the prize.
The trap
Most failed transformations did not fail on technology. They failed because nobody agreed, up front, what success looked like or what it was worth. If you cannot say what the prize is in money, you cannot size the effort, defend the budget, or prove the win at the end.

If you draw a black box around any factory, you will almost always find the same elements that cost money: people, materials, energy, and assets.
For people and assets, time is the factor that matters. We pay people by the hour and we invest in assets, so whenever they are not being used productively, they cost us money. This is typically captured through OEE and line performance targets. The key is to look at performance on a full 24-hour basis, so that losses are not hidden or simply shifted from one bucket to another.
For materials, the logic is straightforward: you buy raw materials to make products. Here too it pays to look at the full picture, comparing what comes in against what leaves as valuable, sellable product. This is typically tracked as material usage variance.
Energy works the same way: look at the totals that go in.
The principle throughout is the black box: measure the total amount that goes into the factory to understand the real size of the prize.
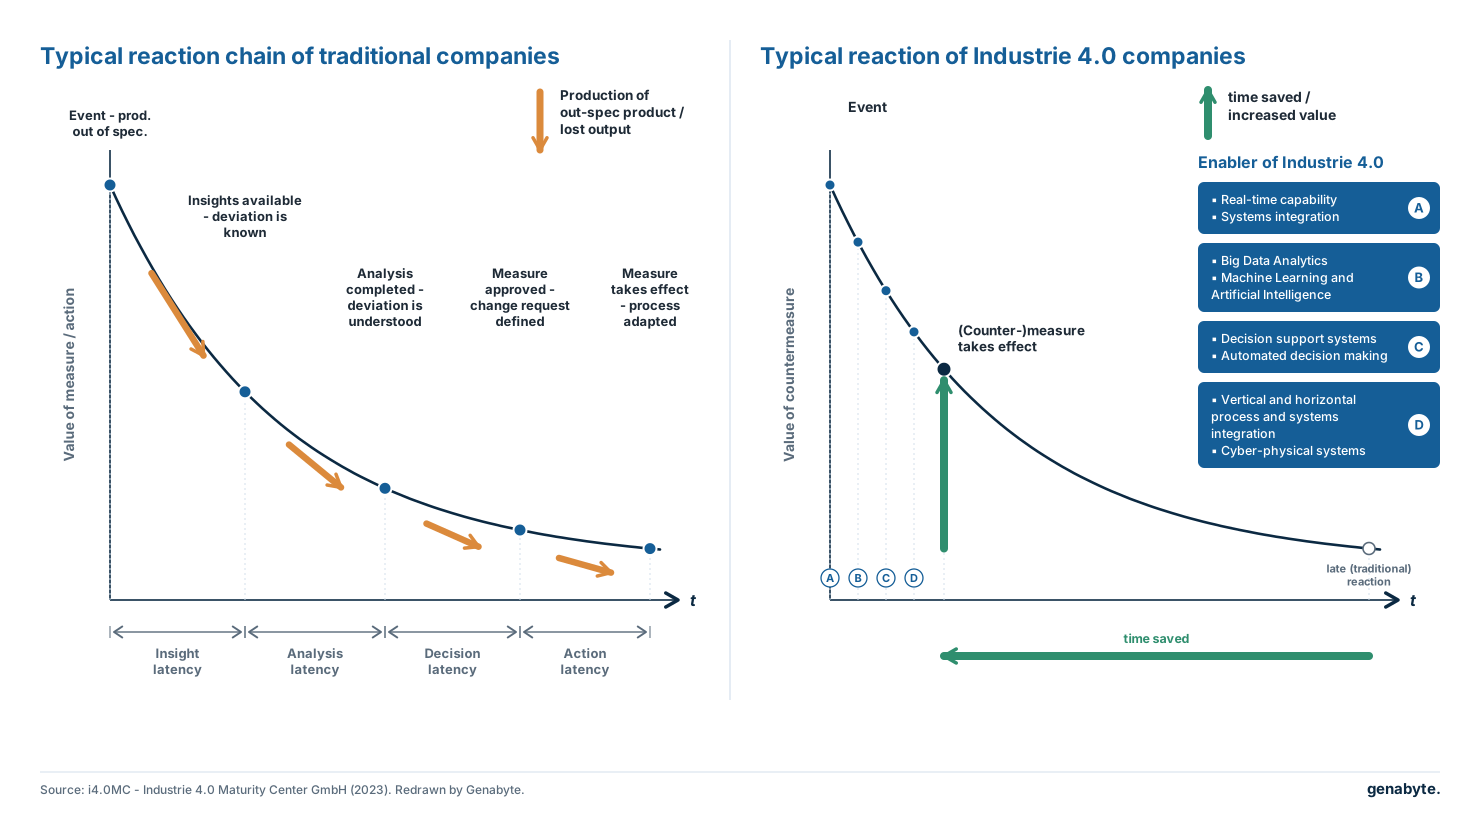
Across almost every use case, value is lost in the same pattern. Over time a deviation appears, but it takes time to even notice it (the detection latency). It does not matter which value driver is involved: for as long as the problem goes unidentified, value keeps leaking away and fresh losses keep being produced.
Once you know there is a problem, it takes more time to work out what is causing it (the analysis latency). After that comes discussion and the time needed to reach a decision (the decision latency), which can be considerable in large organisations. And once the decision is made, it still has to be put into action, costing time again (the action latency).
The whole value promise of Industry 4.0, and of a Unified Namespace more broadly, is to collapse the time of each of these steps.
It starts with better connected sensors and a clearer picture of what is actually happening. This is one of the hardest parts of the manufacturing environment, because we often do not even have the sensors needed to measure the true reality of the factory. Once the data and sensors are in place, real-time dashboarding can show operators the right status, provided the right standards are defined to measure against.
The next step is where big data analytics and machine learning come in. With broader, better-quality data, you can move from spotting problems to analysing their root causes.
Finally, the decision-making itself can be optimised through closed-loop control, effectively automating the decision. This should be done step by step. A sensible starting point is operator validation before any action is taken: the operator must always be able to step in and take control, much like an autopilot. From there the system first guides the operator and shortens the decision, and closed-loop control can then compress the full cycle even further. Not everything can run closed-loop today, but this is exactly where AGVs and robotics will play an increasingly important role in the future.
💬 From the field
One of the most successful projects I worked on involved optimising a specific product property, tied to its rheology, that had a strong effect on price. We started with the historical data and saw a wide spread in performance. The local production site was sceptical that improvement was possible, yet the data showed it had already been achieved in the past.
So we set the team one clear target: consistently produce in the upper quartile of performance. We did not know upfront which parameters mattered, but the goal was unambiguous, and the business case was compelling, with a six-month payback if we reached it. Data quality was poor, and around 70% of it had to be discarded, but the remaining 30% was enough to identify the factors that counted. The team reached the target with relative ease and delivered a significant improvement. That early win earned the mandate to keep going, and with a better understanding of the process we eventually matched the best performance the site had ever achieved.
The key takeaway: a team does not need to be told what it may or may not investigate. It needs a clearly defined goal, a regular forum with the right stakeholders, and a shared definition of success. Being clear on what success means upfront is what lets a project close cleanly within its objectives, before the mandate is extended to invest further.
Field guidance
- ✓Treat every factory as a black box. The inputs are always the same: people (salaries), materials, assets and utilities. Value is hidden in how much of those inputs you convert into sellable product versus waste, downtime and rework.
- ✓Distrust the easy “we can’t win anything here” answer. “OEE is already 95%” - yes, but the line still stops 12 hours a day. There is always something to gain; the job is to find where.
- ✓Quantify in money, not percentages. A CFO does not act on “5% OEE”; they act on “€400k/year”. Convert every opportunity into euros before you rank it.
- ✓Separate hard savings (cash that hits the P&L) from soft savings (freed capacity, risk avoided). Hard savings fund the project; soft savings justify it.
- ✓Size the budget against the prize. Rule of thumb: maximum all-in budget = 3 to 5x the annual value. A €100k/year saving means the project should never exceed roughly €300–500k all-in.
- ✓If the exact value is hard to estimate - and it always is - work with ranges: a realistic worst-case and a realistic best-case. Alternatively, define the 1% value: what is it worth if we improve by just 1%? Both approaches are far better than having nothing quantified, and they give a solid basis for budget conversations and expectation management later on.
- ✓Define the use cases explicitly. What do you want to improve, and how will you know it worked? This list becomes the contract for the whole programme.
- ✓Borrow from Lean. A value stream map of the full process is the fastest way to surface the significant opportunities and avoid optimising things that do not matter.
- ✓Name an owner for the benefit. If no one owns the P&L line that improves, the saving will not be realised, no matter how good the technology is.
Watch out for
- !Selecting technology before the prize is quantified.
- !Accepting “we’re already at 95%, nothing to gain” at face value.
- !Booking soft savings as cash and over-promising to finance.
- !No named benefit owner, so nobody is accountable at realisation time.
Takeaways
- →Write the success measure, in money, before anything else.
- →Max budget = 3 to 5x annual value, all-in.
- →Every use case has a euro figure and an owner.
Phase 2 of 5
Standardise
Fix the foundation before you automate it.
The trap
The trap: automating before the foundations are in place. Technology applied to a broken process does not fix the process, it just makes you faster at doing the wrong thing. Get the people and the process right first, then let technology accelerate them.

Standardization is critical, and the way to get it right is to look at every project across three dimensions: people, process, and technology.
People. You need the right team to deliver a successful transformation. That means a clear RACI and well-defined responsibilities for each team member, so there is a shared blueprint of how the organisation should work and who does what throughout the project.
Process. This is probably the most important dimension. If you automate systems without a clearly defined process, you simply create automated chaos: technology that is faster at making the wrong decisions and reinforcing the wrong way of working. A digital transformation is the right moment to step back, define the operating model, and optimise the way you work before locking it into systems.
Technology. Technology belongs on equal footing with the other two. You need clarity on people and process first, but if you leave technology out entirely you fall back on manual operational excellence, the way of the past, where you never leverage what data can do today and value keeps leaking away through the same latency loop described earlier. The priority today is connected detection and sensors, which is where most of the investment needs to go. Factories have historically underinvested here, even though the technology itself is now advancing fast. Once that data is in place, you can tap into the power of AI for fast predictive modelling. The aim is a proper, structured representation of process, product, and people: live process and product data on the lines, and the knowledge of your people captured in a structured way.
When all three dimensions come together, the people-process-technology triangle puts you in the sweet spot: sustainably creating value far faster than before, and building a real competitive advantage.
Throughout, keep part one in the back of your mind: what is the value we are chasing? If you do not know the total size of the prize, you cannot size the investment. Technically almost everything is possible, but it has to generate a payback. Knowing the prize defines a realistic path to excellence, and it works both ways: it stops you over-investing where there is no return, and it stops you under-investing and leaving value on the table.
People - building the team
A UNS implementation needs a cross-functional team. Each role brings a distinct lens - and gaps in the team show up as gaps in the platform. No single role can substitute for another: the domain expert who knows the process cannot replace the OT engineer who owns the PLC, and vice versa.
Domain Expert
Process / Quality
Interprets the data and owns its meaning. Knows what the process should look like and validates that every reading is process-correct, not just technically present on the wire.
Operational Excellence
Value & Change
Owns the business case, the benefits register and change management. Focuses on business value, links the technical output to the P&L, and bridges the technical team and the wider organisation.
OT
Automation / Shopfloor
Makes the data available and is the sole owner of PLC and edge device modifications. Owns PLCs, sensors and the edge layer as the gatekeeper between the physical process and the namespace. No other team touches PLCs in parallel - this is how you prevent incidents and keep accountability clear.
IT
Systems & Connectivity
Connects to data systems and owns network, identity and integration. Bridges the shopfloor to ERP, MES and cloud, and keeps the architecture compliant with security and access policies.
Data
Engineering / Science
Makes sense of the data and owns the analytics layer. Builds the pipelines, models and dashboards that turn raw signals into actionable insight and make the data usable once it is in the namespace.
Team as a hub
Ideally the team is a cross-functional hub empowered to deliver the full value stream for each use case - from initial request through development to run and maintain. This requires a clear goal from leadership (documented as an OGSM: Objectives, Goals, Strategies, Measures), and the mandate and resources - time, budget and skills - to deliver it without being split across other priorities.
Just as important is a way of working that lets the team share information and progress openly and frequently. Agile is an excellent framework for this. Hold a weekly sync that brings all the critical functions together to review progress and challenges, agree the tasks for the next four or five days, and - crucially - have the sponsors in the room to clear obstacles and make quick decisions. The better this rhythm works, the faster the results come.
Process - definitions and standards
💬 From the field
Practical learnings from the field
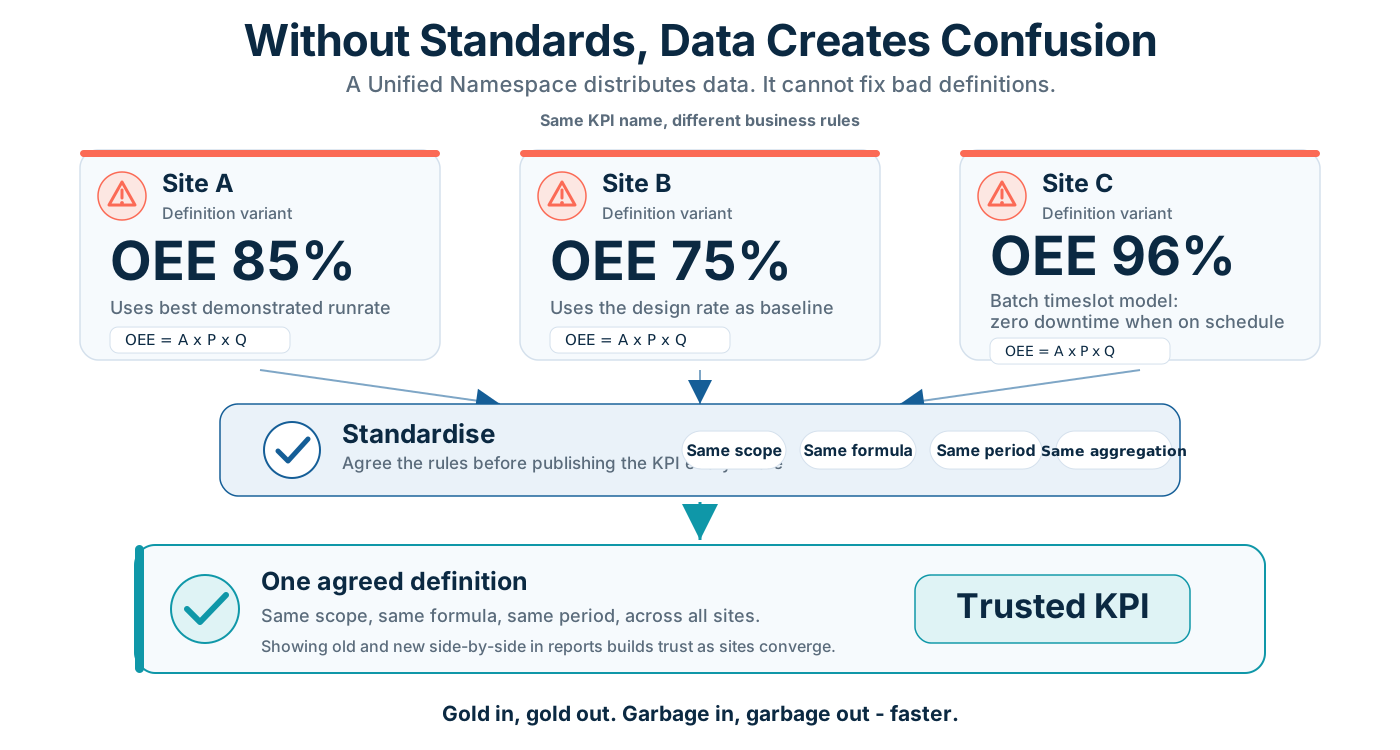
- ✓Standardise your definitions first. One agreed definition per KPI, one set of quality specifications. A UNS will faithfully distribute inconsistent data to everyone at once.
- ✓Standardise units, time and sampling too. Same unit of measure, same timezone, same sampling logic. Mismatches here cause the hardest bugs to find later.
- ✓Standardise what the value cases touch; leave the rest until a use case needs it. Attempting to clean everything before starting is how projects stall before they deliver anything.
- ✓Build trust in the new definition. When you replace a local number with a standard one, be transparent about how it is calculated and show the components. Where it helps, display the old number alongside the new one so people can see exactly what changed and watch the two converge. Align with senior leadership early too: if a KPI feeds bonuses or pay, an unmanaged change becomes a major obstacle to adoption.
Key principle
Build trust early - it is one of the single biggest make-or-break factors for adoption. Most standardisation efforts do not fail on technology; they fail when people stop trusting the change. If the data shown is wrong even once, if a new way of working makes someone look bad, or if teams feel a system is being imposed on them, confidence collapses and people quietly revert to old habits and spreadsheets. Protect trust deliberately: validate the data with the people who will use it before going live, be transparent about what is changing and why, give teams a voice in the design, and never show a number you cannot stand behind. Trust is slow to build and fast to lose, so treat it as a first-class deliverable, not an afterthought.
Deep dive
Technology - design choices
Standardizing technology starts with a clear picture of your data landscape - both the current as-is state and the future to-be state you want to reach. A good mapping of where you are today and where you want to go is the foundation for every decision that follows.
The diagram below shows what a data landscape typically looks like, with its main building blocks. Each block represents a set of capabilities to consider. You will rarely fill every block at once, and you do not need to: one of the major strengths of a UNS approach is that it is modular. You can keep what already works today and fill only the blanks that matter now.
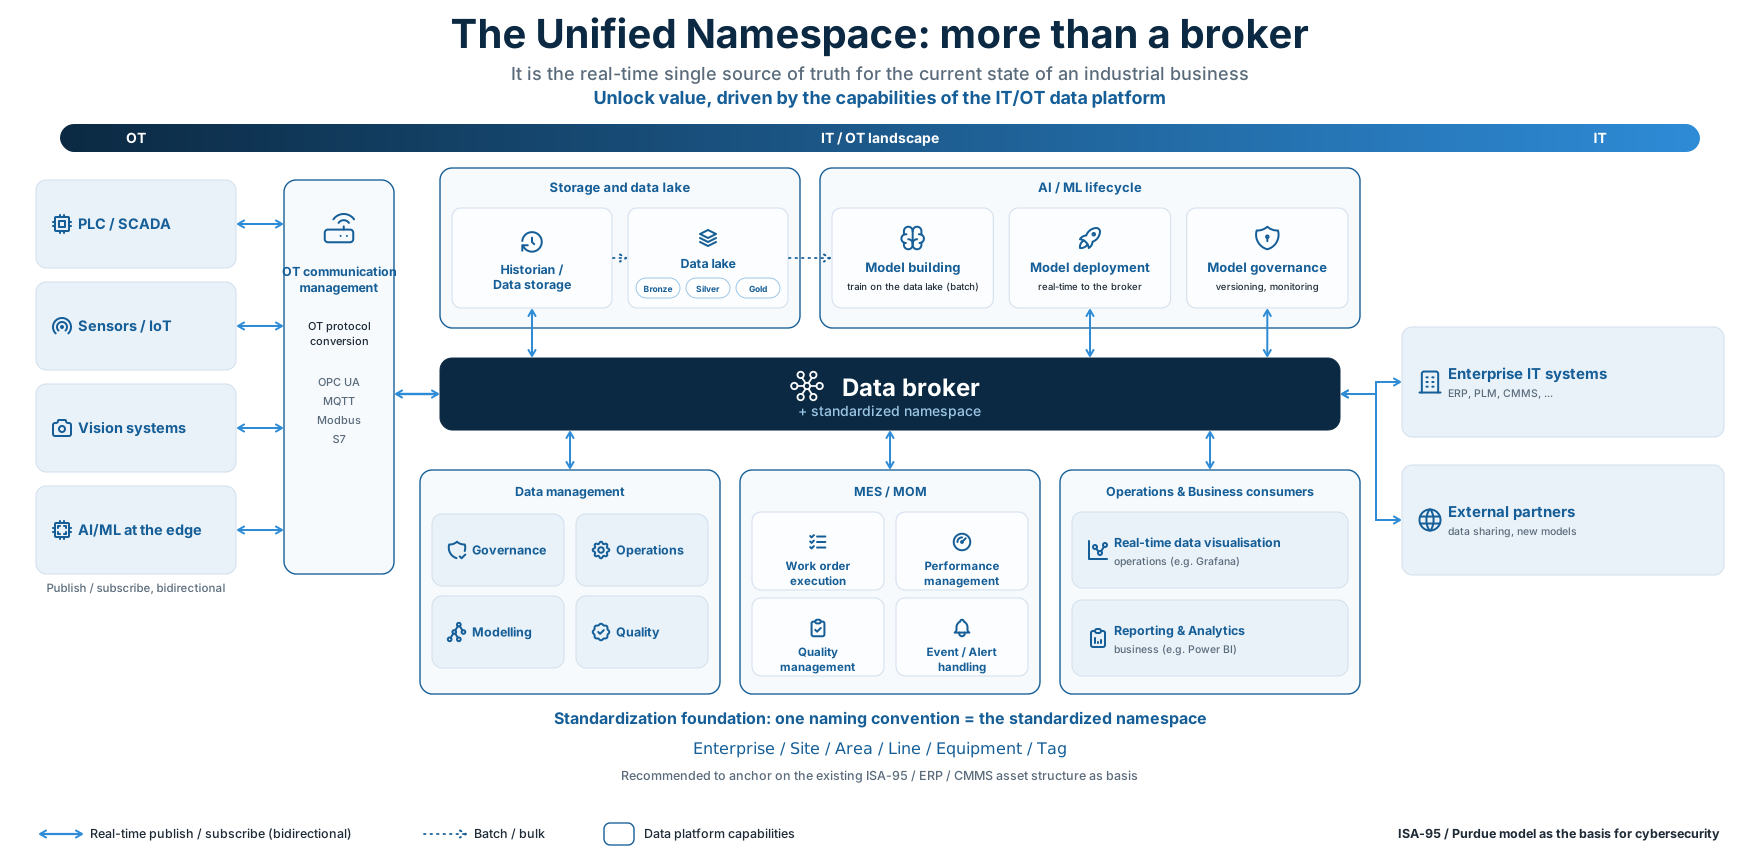
Block by block
OT communication management
Start at the OT layer. Map the types of PLC across your sites - look across multiple plants and capture the majority, not every last detail. The goal is to know the main brands, and therefore the main protocols, you are dealing with, because that determines your data interfacing requirements. Do not forget standalone IoT devices such as temperature sensors and other equipment that sits outside the PLC world. Together this gives a clear view of what your data interface needs to support.
Data management
Data management is one of the most important blocks in the platform. Most platforms offer some combination of data operations, data modelling, and data quality, and the differences matter.
- ✓Data operations: running calculations on your data and standardizing it, for example converting units of measure.
- ✓Data modelling: creating standard objects so you can carry your equipment definitions and naming standard through into the solution.
- ✓Data quality: out-of-the-box validation of incoming data. Not every platform offers this, and where it exists it can be a real differentiator.
Storage, historian & data lake
Storage is where you need to think carefully, because many platforms do not ship with a dedicated data store. You may already have a historian that is perfectly suitable to connect to. In a classic ISA-95 setup, the historian is usually wired directly to the SCADA layer, and you do not need to rip that out from day one. Start by adding new functionality through the data broker and build up the new standard gradually. Standardization is always a trade-off: do not rework everything that already works, because that consumes time and resources without contributing to payback. Change what brings value, and leave the rest for later.
For the historian, map your target users carefully, because their needs differ:
- ✓Automation engineers need to visualize short-term trends at high frequency to validate new data points as they come online.
- ✓Domain experts such as process, quality, and reliability engineers need to recall data over much longer periods.
Legacy historians often ship with specialized trending tools that not every modern data platform matches. Open-source tools are excellent for real-time dashboards, but they are generally not built for high-frequency real-time trending - an important distinction to keep in your functional requirements.
On the data lake side, many companies already run a platform such as Databricks or Snowflake for building and deploying models. Check how your historian and data lake interface with each other up front, so it is covered in the design rather than bolted on later.
AI/ML at the edge & model deployment
Model deployment is often something you want to bring close to the shop floor. For longer-term optimizations the cloud is fine, but where you need to actively control the process - advanced process control, for example - you will want to deploy in the OT layer. Latency and cybersecurity both push in that direction. You also need model governance to maintain and manage models over time. This does not have to live in a single platform; several solutions do it well. Start from what you need to be able to do.
Operations & business consumers
Real-time visualization for operators - showing data from the full factory across multiple sources - is a strong added value. This is where UNS really comes into its own, because you can combine MES, ERP, and OT data in a single dashboard.
Reporting and business analytics are a more long-term play, and that data usually comes from the historian or data lake rather than straight from the data broker. Pushing live data into a Power BI report is generally not the way to go. Keep the distinction clear: a real-time dashboard visualizes what is happening now, while a Power BI report covers day, week, and month reporting. Capture that time horizon explicitly in your functional requirements.
MES / MOM
For MES or MOM, it depends on what you want to achieve. In a classic ISA-95 stack, MES sits above SCADA with a direct connection. The trend is to put a data broker in between and step away from that point-to-point link. MES suites traditionally bundle every capability, but more and more solutions are now available as standalone modules. The data broker is what unlocks this: keep the old solution running, publish the relevant information onto the broker, run a new application in parallel, and once it is tested and trusted, retire the legacy functionality and switch over - all without a big bang. This is what makes a gradual, low-risk move to modular solutions possible.
Enterprise IT & external partners
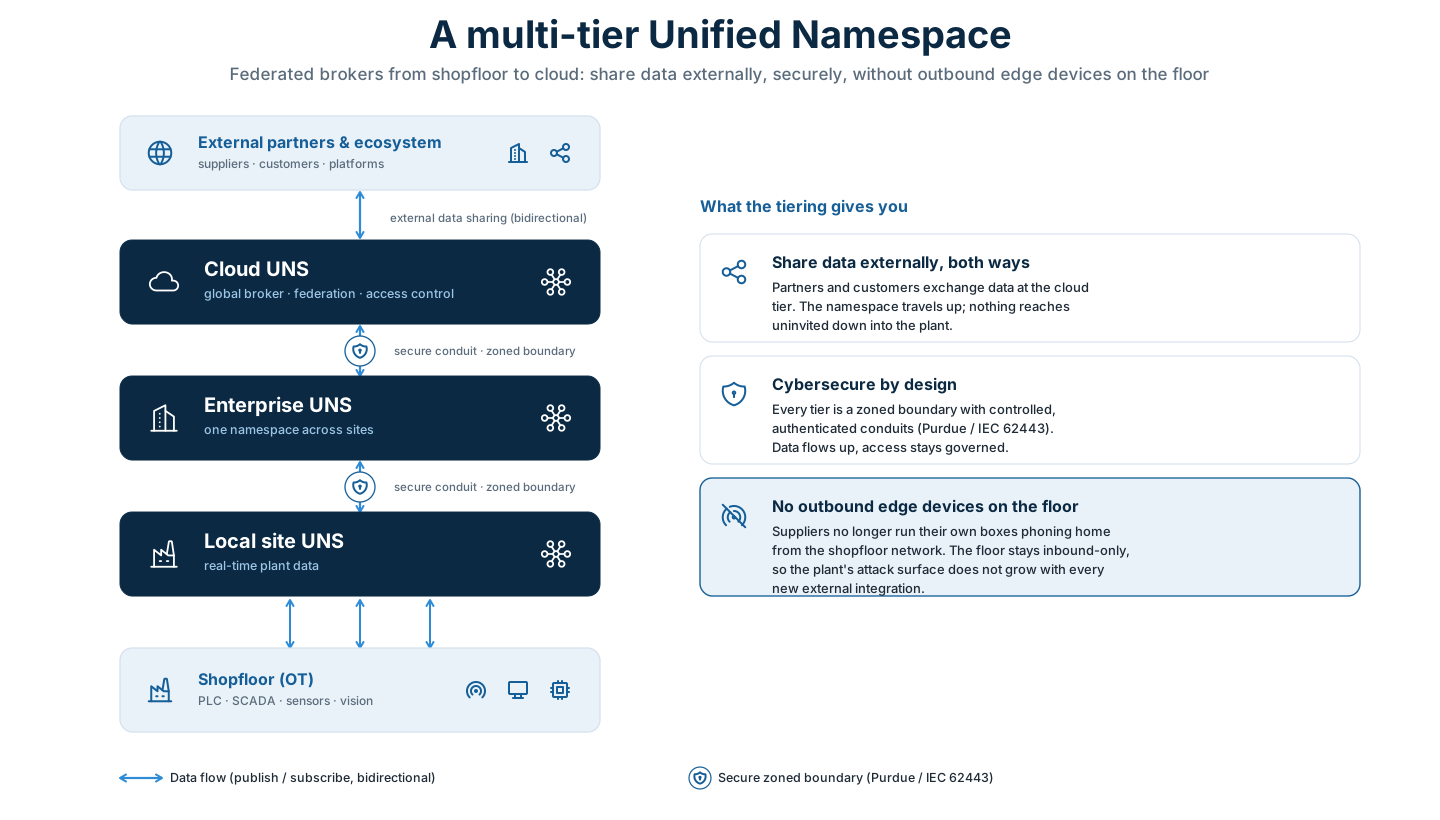
Many companies add edge devices on the OT layer to monitor their machines. It is easy and convenient, but every one of those devices typically opens a direct connection to the internet, which dramatically increases the attack surface and the security burden. With cyber risk rising, that is not the way to go.
A better practice is to use the UNS, and later a multi-tier UNS, to share data with external partners. It lets you publish exactly the data you choose and supports bidirectional communication through a single, secured API. You decide what to share, you let partners send data back, and that data can be used at every level of the organisation - from real-time dashboarding and historization all the way down to interfacing with PLCs where appropriate. This opens up remote monitoring, predictive maintenance, and in time the deployment of predictive models in the cloud to optimize machine settings in real time without running them locally. A future-proof data platform should be ready for exactly this.
General approach
With the blocks understood, the approach is straightforward:
- For each block, define your current as-is state and the solutions you already have.
- Identify the gaps where you have nothing yet.
- For each block, list your main functional requirements. This is the basis for going to market.
Some providers cover several blocks at once; others specialize in a single niche. Whether you fill the gaps with one broad platform or a best-of-breed combination depends entirely on your landscape. The modularity of UNS is what gives you that freedom.
Change management
Every transformation ultimately succeeds or fails on how well the organisation manages change - not on the technology it selects. This course does not go deep on change management: it is a discipline rich enough to deserve a dedicated training in its own right, and one with deep roots in Lean thinking. The Lean principles that underpin operational excellence - eliminating waste, building flow, engaging the people closest to the work - apply just as directly to the human side of a digital transformation as they do to a production line.
What is worth calling out here is that the technical and methodological phases in this roadmap will stall without the organisational side working in parallel. A few frameworks are worth knowing. Kotter’s 8-step model is the long-established reference. A more recent and, in our view, particularly useful framework is the Six Batteries of Change from Vlerick Business School - built on four years of research across more than 300 organisations - which maps out exactly which organisational dimensions have to be active for a transformation to stick.
.svg)
The model maps two kinds of energy - rational and emotional - across three levels of the organisation: the top, the middle, and the shop floor. That gives six batteries, and the central insight is simple: all six need to be charged, because a flat battery anywhere drains the others.
- ✓Clear strategic direction (rational, top) - a sharp, well-understood strategy that gives the change a clear destination and rationale.
- ✓Ambitious top team (emotional, top) - united, inspiring leadership that supplies the drive and credibility to power change from the top.
- ✓Powerful management infrastructure (rational, middle) - the structures and systems that turn strategy into something that can be managed and tracked.
- ✓Healthy culture (emotional, middle) - an open, collaborative environment where new ideas are welcomed rather than suppressed.
- ✓Action planning & implementation (rational, shop floor) - disciplined project management that translates strategy into delivered results. One of the hardest batteries for most organisations.
- ✓Strong connection with employees (emotional, shop floor) - genuine engagement with the people doing the work, building the commitment that carries change through on the front line.
Source: Six Batteries of Change, Vlerick Business School (P. De Prins, G. Letens, K. Verweire, 2017).
Naming convention
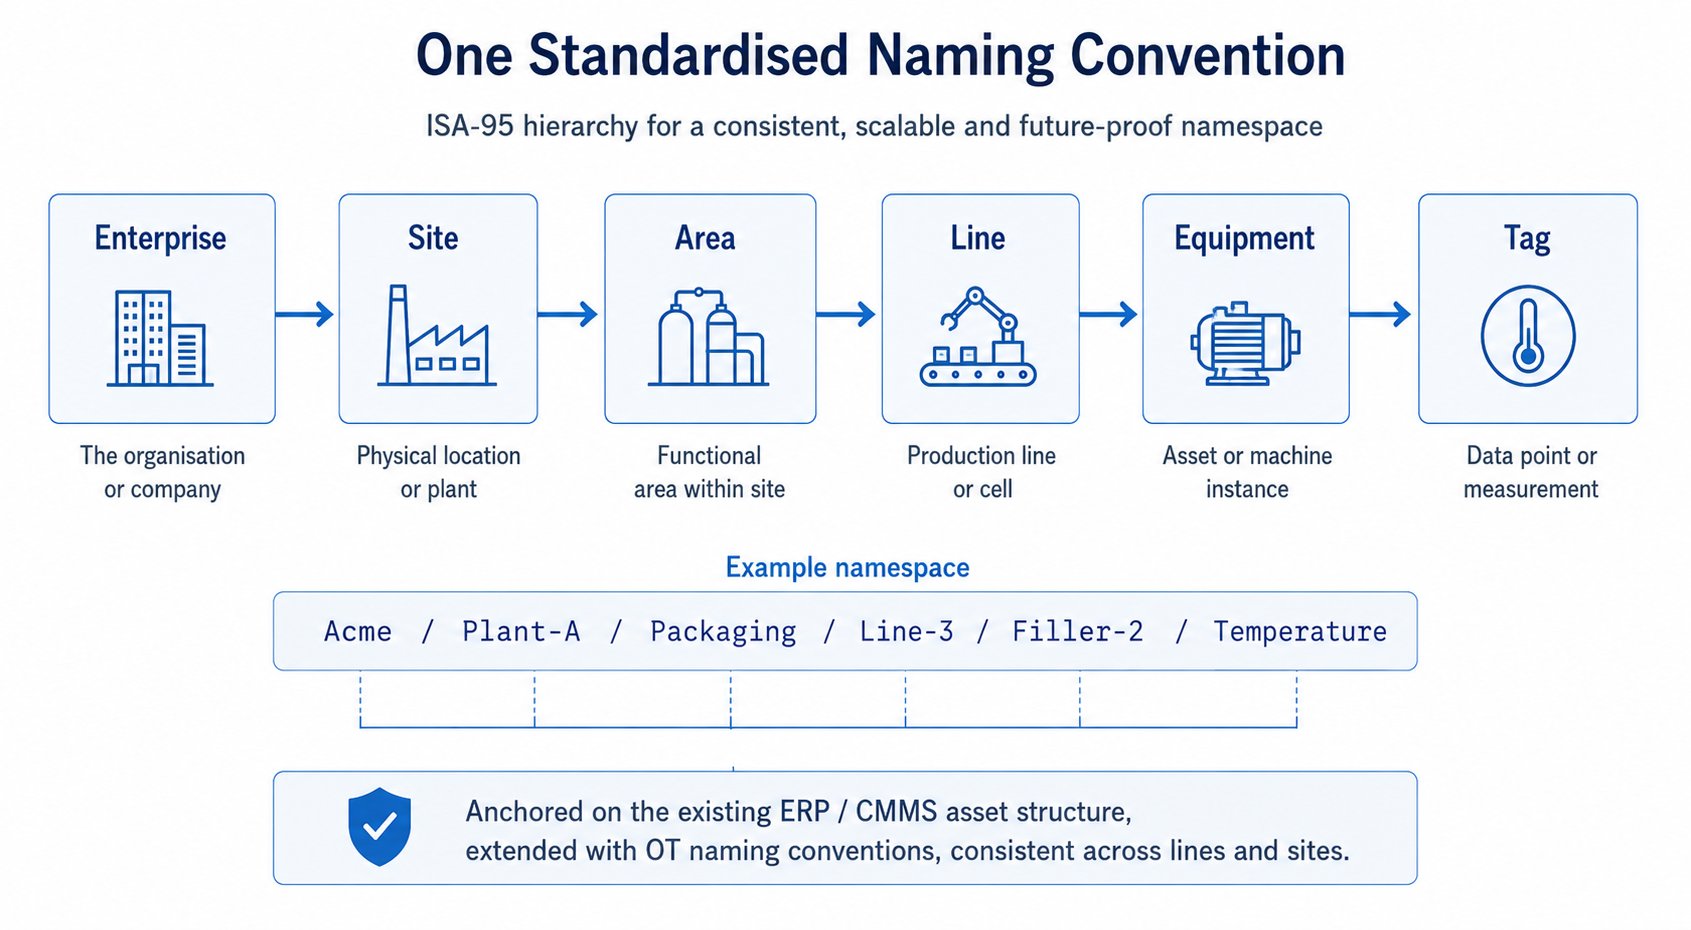
The naming convention sits at the intersection of process and technology - it requires a process decision (what hierarchy makes sense for your operations) and a technical implementation (how the mapping layer enforces it). It deserves its own attention: getting it right before pilots begin saves significant rework later, and getting it wrong is one of the most common reasons a UNS becomes unmaintainable at scale.
This is the part practitioners most often get wrong. You almost certainly already have a convention in your CMMS or SAP - start from that and keep it pragmatic.
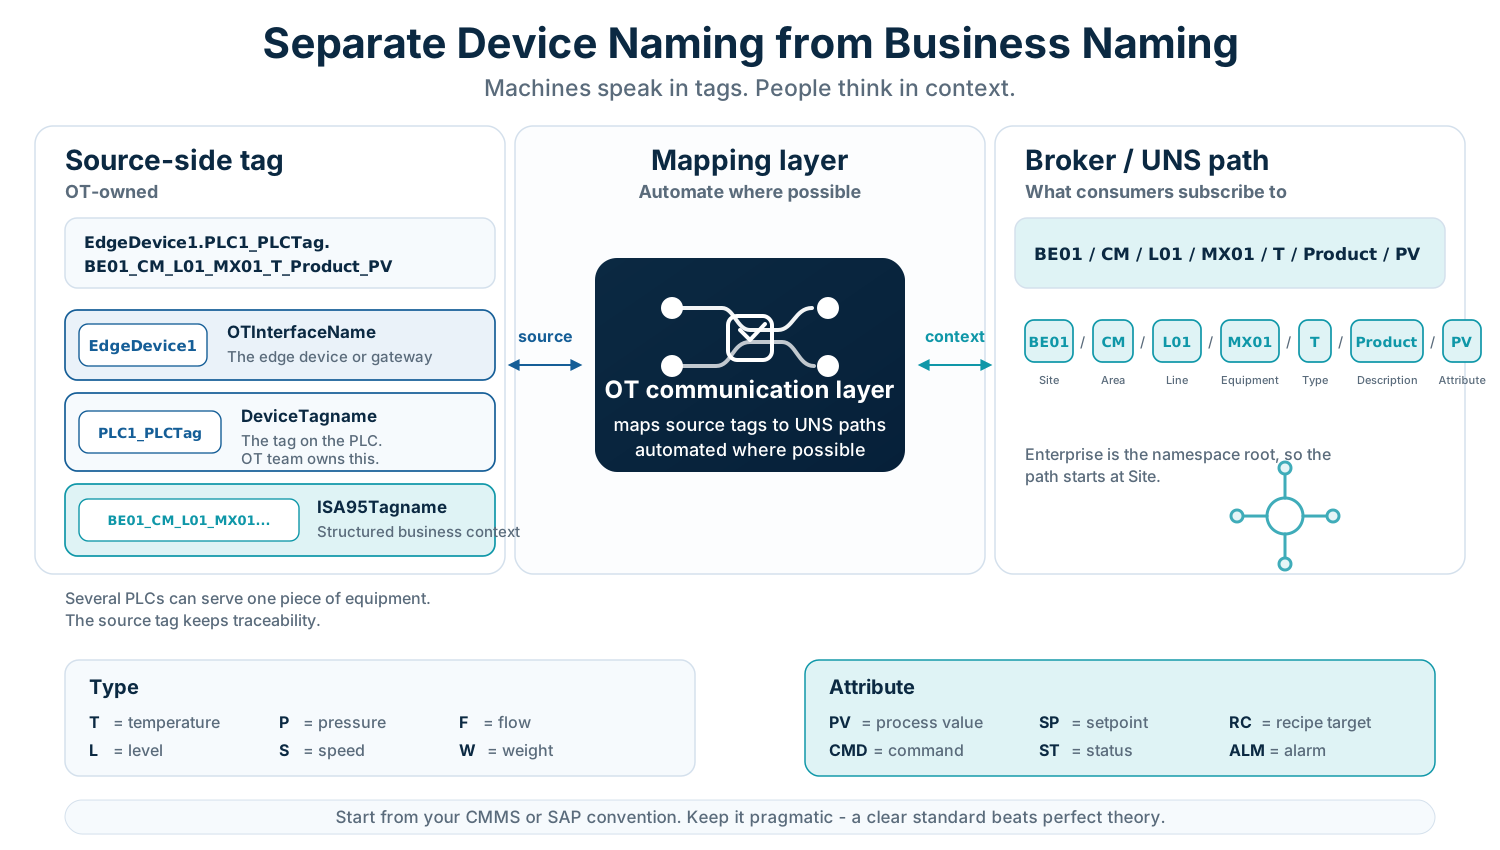
In practice a full UNS data landscape requires a dual naming convention. Machines speak in device tags - raw identifiers owned by the OT team that trace back to a specific PLC or sensor. People and systems think in business context - a hierarchy that follows the ISA-95 asset structure. If you collapse these two into one, you either lose traceability (the OT side suffers) or you force business consumers to parse raw PLC tags (the IT side suffers). Keeping them separate and mapping between them - automatically where possible - is the pattern that scales.
Dual naming convention
Device name
Identifies the tag in the source device. Owned by the OT team. Used by the communication layer so every tag traces back to its source. Several PLCs can serve one piece of equipment, so this segregation matters.
Broker name
Follows the ISA-95 asset hierarchy: Site / Area / Line / Equipment / Tag. This is what consumers see in the UNS.
Combined pattern: OTInterfaceName.DeviceTagname.ISA95Tagname
Tag structure: Type.Description.Attribute
- Type - T = temperature, P = pressure, F = flow, L = level, S = speed, W = weight
- Description - what is measured - e.g. Product, MotorOil, Steam
- Attribute - PV = process value, SP = setpoint, RC = recipe target
Worked example
Source tag: EdgeDevice1.PLC1_Tag.BE01_CM_L01_MX01_T_Product_PV
UNS path: BE01/CM/L01/MX01/T/Product/PV (Site / Area / Line / Equipment / Type / Description / Attribute)
The OT communication layer maps source tags to UNS paths. This mapping can and should be automated, so engineers maintain it in one place rather than by hand.
Watch out for
- !Trying to clean all data before starting (boiling the ocean).
- !Distributing inconsistent KPI definitions faster via the UNS.
- !Skipping the RACI, so multiple teams end up touching PLCs.
- !Assuming MQTT fits everything, then discovering you needed transactional guarantees.
Takeaways
- →One definition per KPI, agreed and written down.
- →Clear ownership: who may change a PLC, and who may not.
- →Match the protocol to the data - telemetry vs transactions.
From naming to equipment definitions
Your naming convention is also the foundation for the next step up: equipment definitions, the point where templating enters the picture. For each type of equipment, you standardise the minimum set of data points you always want to capture. A mixer, for example, will always expose product temperature, motor amperage, mixing speed and weight; an oven will always expose its burner temperatures. You do not need a separate template per brand - the data points are usually the same - but you do want clear guidance that says: if it is a mixer, these are the tags we capture as a minimum.
The same applies to capability-specific objects that recur across many machines. Wherever you track machine state, for instance, you standardise the same attributes - runtime status, downtime reason code, alarm status - so every asset reports them the same way. Building these up gives you a library of standard equipment definitions that sits alongside your naming convention.
This library becomes a powerful engineering standard, and it is how you stop the problem at its source. When your engineers procure new equipment or a new production line, the equipment definitions tell them, and the supplier, exactly which data points must be exposed and how they should be addressed and mapped on delivery. Instead of retrofitting line after line, you close the tap at the source: new equipment arrives already specified for the UNS, connecting it becomes far faster, and the naming is known before installation even begins. The same definitions still guide the teams retrofitting existing lines, work that can otherwise be slow and iterative.
A practical way to build the library: when you work out the first example for a line, do it so that that worked example becomes the first version of your equipment definitions. Start from concrete, value-driven use cases, but make sure their output is deliberately converted back into the standard. Done properly, every use case you deliver also leaves you with a reusable template for the next one.
Phase 3 of 5
Gap-Fit and Design
Best of breed, no big bang.
Now that we have defined our standards for People, Process, and Technology, and set out the naming convention and the change management strategy, we can move on to the most rewarding part: selecting the components that will fill in the solution. The guidance below focuses on the implementation side, working from the technology layer upward. There are far too many providers to cover individually, so rather than reviewing products, the aim here is to share a practical method and a few names worth considering.
Field guidance
- ✓Assess the landscape component by component: what must be replaced, what can be added, what stays. The whole point of a UNS is modularity - no big bang. Anchor every decision to the value you are delivering.
- ✓Do not force one vendor into every box. Combine best-of-breed solutions. The broker is what makes best-of-breed affordable, because it decouples the pieces.
- ✓Fewer interfaces is a benefit, not the only criterion. A suite that ticks several boxes can still be the wrong fit. Weigh interface reduction against fit, openness and lock-in.
- ✓A practical scoring shortlist per module: open-standards support (MQTT, OPC UA, Sparkplug B), native version control and backup, security (segmentation, authentication, audit), scalability, TCO, vendor viability, and fit to your RACI.
- ✓Make the target architecture compliant with ISA-95 and the Purdue model from day one. Cybersecurity is a design input, not a later add-on.
- ✓Insist on native version control and backup. It makes patch handling, rollback and audit dramatically easier, and it is the difference between a maintainable platform and a fragile one.
- ✓Build data validation into roles and responsibilities. The automation engineer verifies the tag is mapped correctly; the domain expert confirms the value from a process point of view. Two checks, two owners.
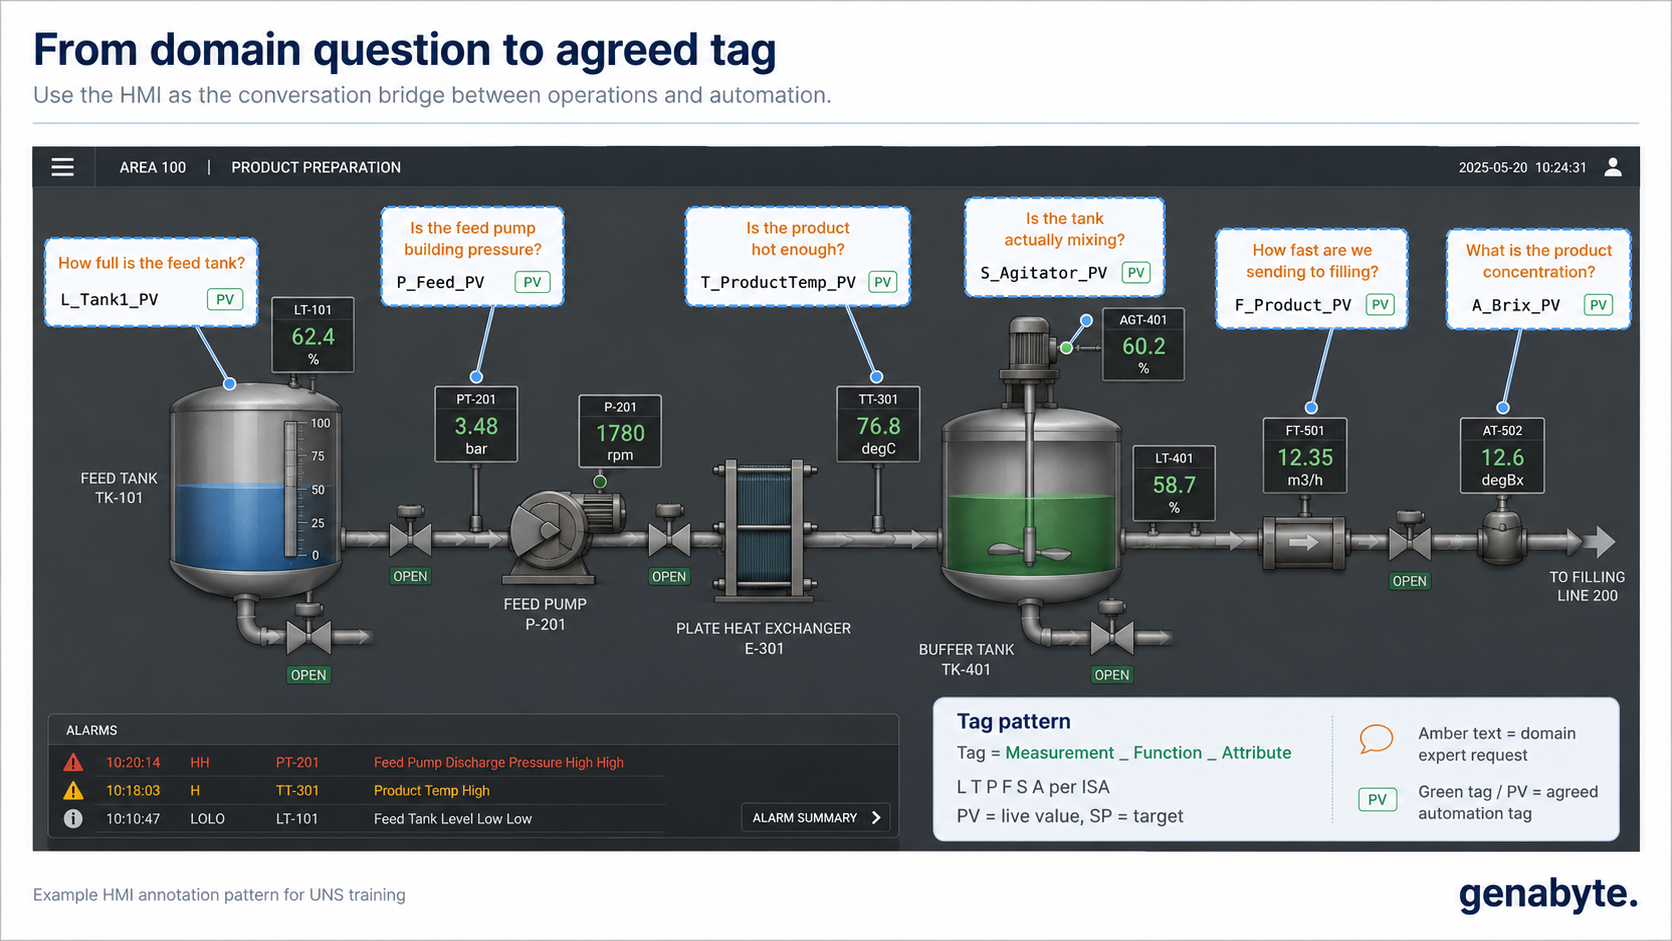
- ✓Use the HMI as your spec. Start from screenshots of the HMI/SCADA, have domain experts mark which data points they want, and write the target tag name straight onto the screenshot.
Deep dive: HMI as your specification
Tendering methodology
The right way to approach this is a structured tendering process:
- Start from your value drivers. Be clear about what you are trying to achieve.
- Translate them into clear functional requirements for each block.
- Build a short list of candidate vendors per block.
- Send out an RFI (request for information) and let vendors respond. This alone usually filters out several candidates.
- Invite the rest to a short demo. One-hour sessions across a single day work well; you can screen six to nine vendors in a day if you keep them tight and to the point.
- Use the results to sketch a few prototype landscapes that tick all the boxes.
- For each candidate landscape, forecast the total cost of ownership. Do not forget hosting, licensing, serviceability, and the level of service the vendor can realistically provide. Vendor size matters too: a large multinational has very different needs from a one or two site producer, and the fit should match.
The choices are rarely clear-cut because capabilities overlap heavily and there is seldom a genuinely bad option. The goal is to find what fits the culture and size of the company, while checking the right criteria up front so the design does not create problems later. The design and selection phase is one of the most important in the whole journey. Template checklists will be made available to support this.
Vendor landscape - some players worth considering
The following are examples to consider, not recommendations or a formal review. The vendor landscape is rich enough to deserve its own dedicated training. These are names that, in our experience, all have credentials worth including in a shortlist.
Litmus · litmus.io
A strong player with a broad library of interfaces and excellent OT communication, plus a well-developed data management layer. Weaker on storage and data lake out of the box, but works well with open-source tools such as Grafana, Influx, or TimescaleDB. Highly modular, mature version management is a real differentiator. Can be deployed across the OT stack with central governance and includes a built-in app store for model deployment.
Ignition
More of a complete production suite covering SCADA, MES functionality, data management, and storage. Think of it as a broad platform rather than a pure communication layer. A very strong candidate where multiple gaps exist across both SCADA and MES.
Kepware
The de facto historical standard for OT interfacing, with a very broad protocol library. Its age is both a benefit (well established) and a drawback (less modern interface). Worth considering as a complement where protocol breadth is the priority.
Highbyte
A focused data management candidate. Founded by former Kepware leadership - including former Kepware CEO Tony Paine - but an independent, venture-backed company with a separate product. Strong on data operations and modelling, and worth evaluating alongside Kepware if data management is a gap in your shortlisted landscape.
Factry.io
A Belgian player with strong OT communication and solid historian and data management capabilities. Clear manufacturing understanding and a credible homegrown candidate for European setups. Does not cover every protocol, so for sites with a highly diverse PLC estate it is worth pairing with a dedicated interfacing tool.
Vintecc
Another Belgian player with a broad set of capabilities and custom development. A good fit for smaller companies with a less dispersed footprint. Protocol coverage is narrower than the dedicated interfacing specialists, so factor that in for multi-brand OT environments. Local proximity is a genuine advantage for companies without a large global footprint.
Siemens Opcenter
A comprehensive MES/MOM suite covering production scheduling, quality management, performance analysis, and traceability. A natural fit where the broader Siemens automation ecosystem is already in place, and a strong candidate where MES is a significant gap in the roadmap.
AVEVA (incl. AVEVA PI)
AVEVA PI - formerly OSIsoft PI - is arguably one of the best historians on the market. Think of it as the Rolls-Royce of historians: exceptional depth and reliability for high-volume, high-frequency process data. The broader AVEVA suite also covers operations management, engineering, and business intelligence. Expect higher cost and integration complexity.
GE Proficy
Considerable capability across the stack including historian, SCADA, MES, and analytics. A mature platform with a wide installed base in discrete and process manufacturing. Expect higher cost and integration complexity relative to newer modular options.
Canary Labs
A strong historian specialist worth including in the shortlist. Less open than open-source alternatives such as Influx and TimescaleDB, but comes preconfigured - which significantly reduces setup effort. Depending on how much you want to manage yourself, a very credible option.
This list is not exhaustive - there are certainly strong names missing. An open question worth raising: what vendors do you work with or consider in your environment?
Watch out for
- !Forcing a single vendor into every box.
- !Choosing on “fewest interfaces” alone and ignoring fit and lock-in.
- !Treating segmentation and cybersecurity as a later add-on.
- !Over-engineering the naming convention into semantic paralysis.
- !No native version control or backup, so patching becomes painful.
Takeaways
- →Keep what works; replace only what blocks value.
- →Score each module on open standards, security, version control, TCO and RACI fit.
- →One pragmatic naming convention, dual device/broker, mapping automated.
Phase 4 of 5
Value-Delivering Pilots
Now the clock is ticking - have you delivered benefit yet?
.svg)
Value is won through two complementary loops. The first is Detect & React: shortening the time between a problem appearing and an operator acting on it. The second is Analyze & Standardize: understanding what drives performance well enough to eliminate the problem at the root and lock the improvement into a new standard. Together these loops feed each other - better detection leads to better analysis, and better standards raise the baseline from which the next problem is detected.
The UNS is what accelerates both loops: better-connected data means faster detection, faster analysis, and faster deployment of the new standard. Every pilot should be designed to shorten one or both loops and prove that compression in euros.
Inspired by the Efeso infinity loop in WCOM™.
The trap
The platform is selected and the basics are in place. From here, every week without a delivered benefit erodes credibility and budget. This is the fun part and the hard part: turning capability into proven value with small, real use cases.
Field guidance
- ✓Start with small use cases. Small and proven beats big and theoretical.
- ✓Every use case counts. A licence cost avoided, energy saved, time saved on a trial run - log all of it. Value accumulates from many small wins, not one heroic one.
- ✓Keep a benefits register. A SharePoint or shared Excel where every use case is documented with baseline, mechanism, owner, euro value and validation status. Document as you go.
- ✓Get finance to co-sign. Self-reported savings get discounted heavily and quietly. A number validated by finance sticks, and it compounds your credibility for the next increment.
- ✓Start with energy. It is easy to meter, easy to quantify, and the baseline is rarely disputed.
- ✓Choose pilots that are repeatable, not just easy. A win you cannot roll out teaches you nothing about scale.
- ✓Most use cases fall into two clusters: Detect & React - shorten the time to notice and respond to a problem; and Analyze & Standardize - understand the standard well enough to attack the problem at the root.
- ✓The underlying mechanism is time. Value leaks the entire time the loop is open - detect, analyse, decide, act. The purpose of the UNS is to compress that loop.
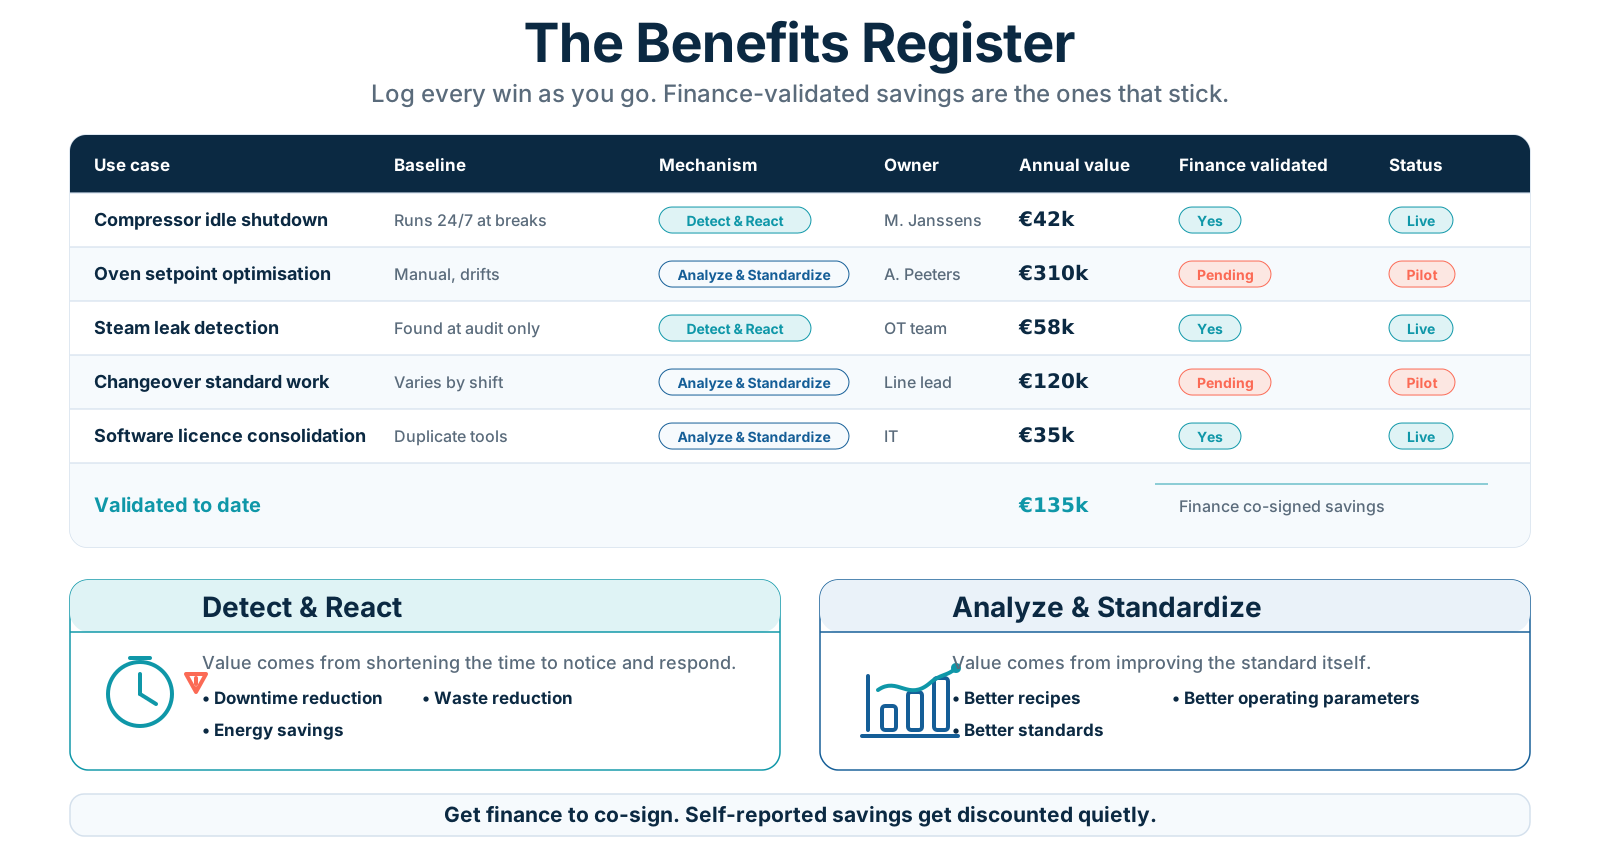
In practice, value from a UNS programme accumulates from many small contributions. Each individual win may seem modest, but tracked together they create awareness, build the business case for continued investment, and - critically - reveal which use cases are repeatable enough to scale across lines and sites. A benefits register that is maintained as you go is the difference between a programme that earns its keep and one that quietly runs out of budget and mandate.
Watch out for
- !Picking the easy pilot that cannot be rolled out.
- !Not logging wins as you go, so you cannot prove value later.
- !Self-reporting savings without finance sign-off.
- !Chasing a big-bang pilot instead of small proven wins.
Takeaways
- →Start with energy; it is the easiest euro to prove.
- →Log every win in a benefits register as you go.
- →Finance-validated savings are the only ones that stick.
Phase 5 of 5
Roll Out and Scale
Where the UNS earns its keep.
The trap
The first use case is slow and expensive - that is normal. The mistake is treating every subsequent rollout the same way, or letting the standard drift as you scale until the spaghetti grows back. Scale is where discipline pays off or unravels.
💬 From the field
Once the KPI definitions were standardized and the first dashboards were live, we introduced a DevOps approach to maintain the dashboard definitions in version control. Every dashboard became a template - the same structure, the same KPIs, the same naming convention - so that deploying to a new line was a matter of changing the site and line identifiers and running the pipeline.
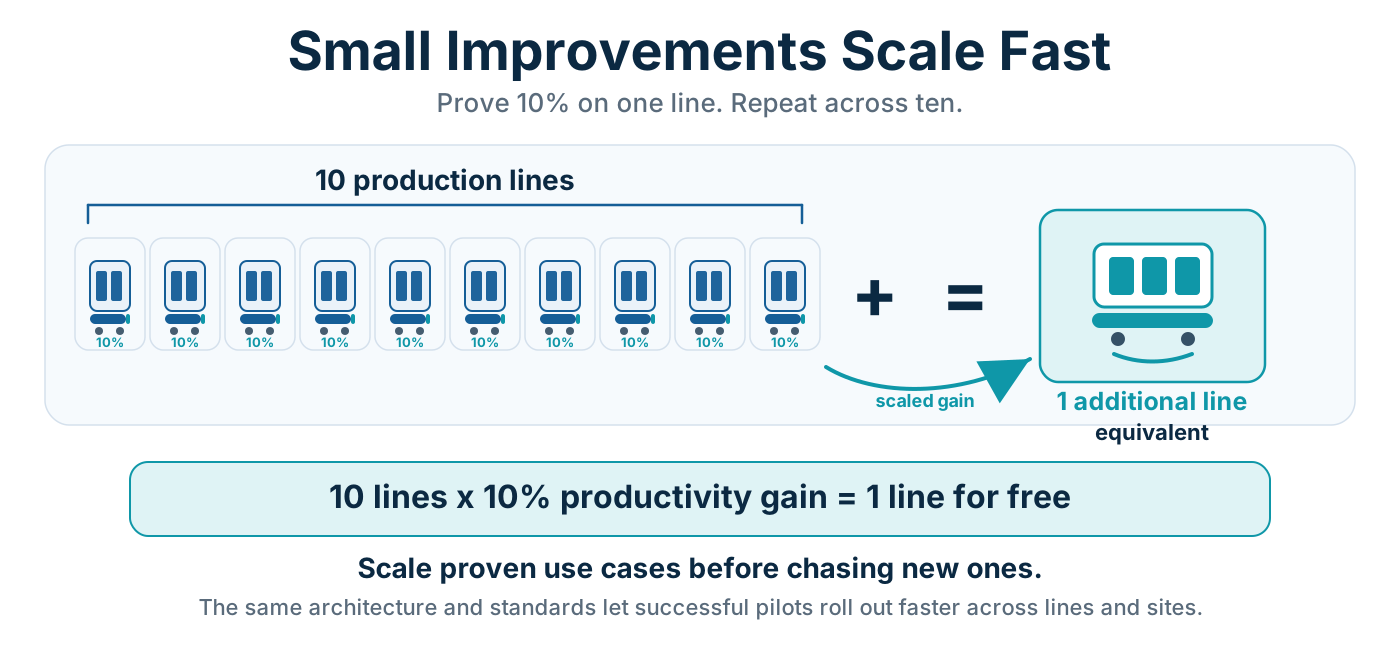
The first site had improved run rate on one line by 10%. Once the standard held, rolling that exact use case out to a second site took a few hours. A third site, a few hours more. When you have ten lines running the same standard, 10 times 10% is the capacity of a full production line delivered for free - without building a new factory, without hiring more people.
This is the moment senior executives stop asking about the technology and start talking about the business. It is also the moment the programme earns real mandate - not because of what was promised, but because of what was already delivered and already proven to scale.
Field guidance
- ✓This is where the UNS pays off. Because every line and site shares the same standard and architecture, proven use cases roll out far faster than the first one.
- ✓The magic of scale: save 10% across 10 production lines and you have effectively earned one production line for free. That is the sentence to put in front of your CFO.
- ✓Spend roughly 60 to 70% of effort scaling what already works and 30 to 40% on new innovation. Resist the urge to keep inventing while proven value sits un-deployed.
- ✓Template everything. Dashboards, models and connectors built once should deploy in hours, not weeks. If a rollout still takes weeks per site, your model is not yet standard enough.
- ✓Govern against drift. As scope grows, standards must be actively enforced, or you slowly re-create the spaghetti you removed. A small centre of excellence and a written playbook are cheap insurance.
Scope evolution: the tiered UNS
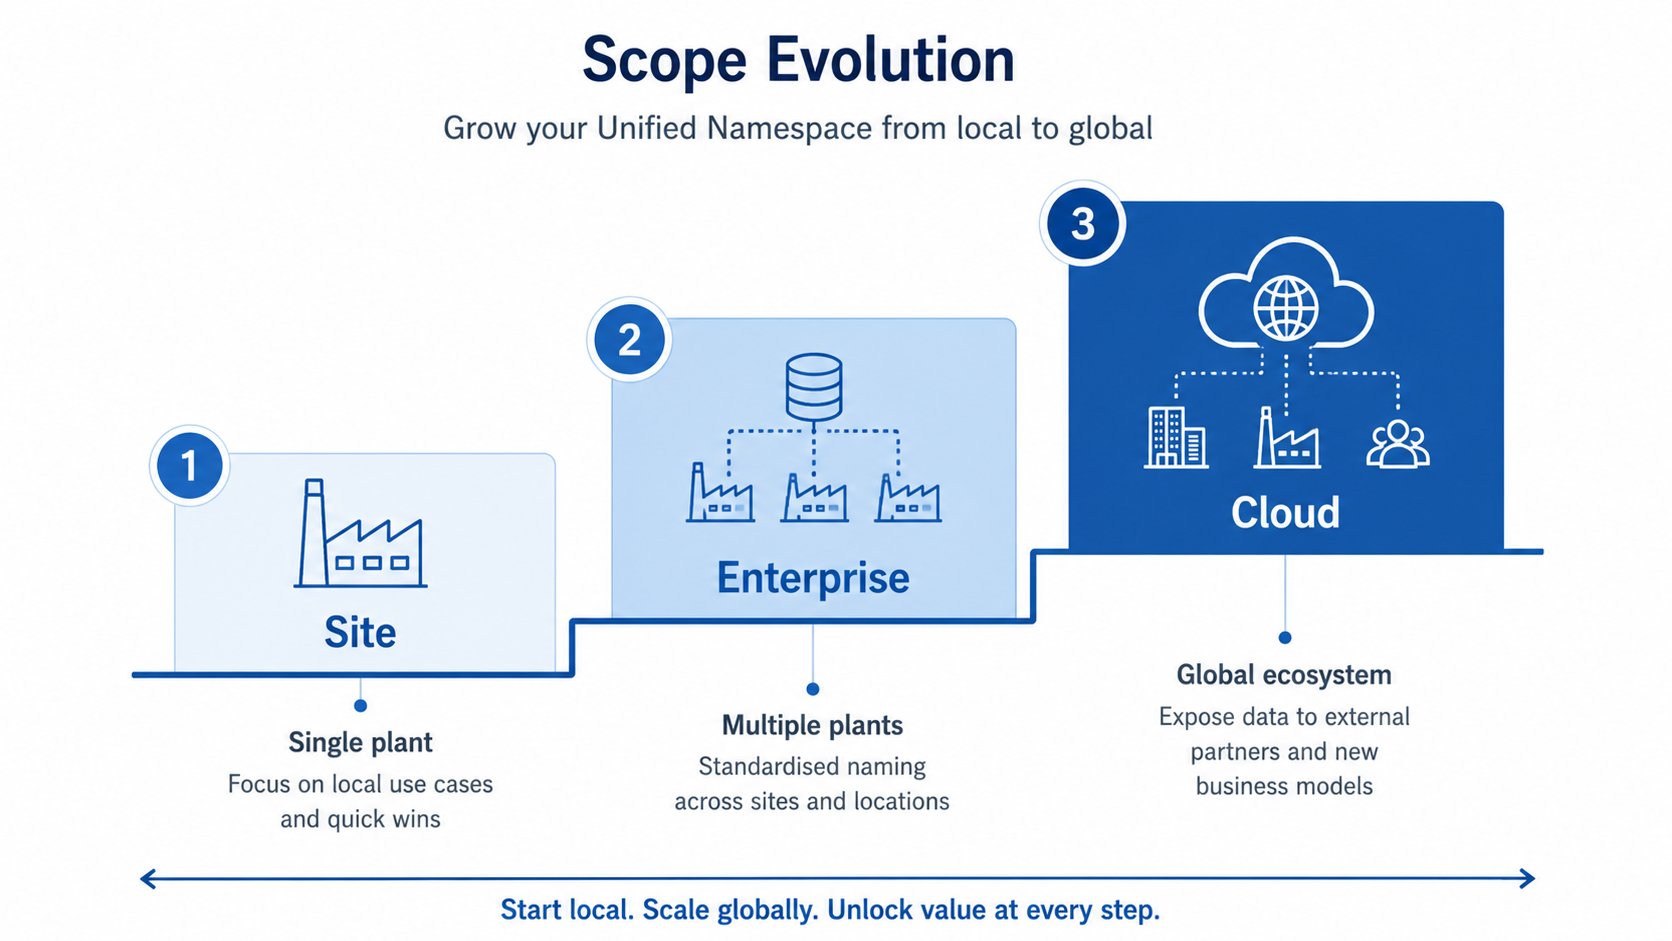
A UNS can start at a single line or site, then expand: multiple sites, group ERP integration, and eventually a cloud tier for cross-site analytics. It is normal for more than one namespace to coexist while the approach matures. Integrate rather than rip and replace, and let proven use cases drive the next increment.
The cloud tier also solves external data sharing: publish what you choose to share on your own cloud broker and grant suppliers access, instead of letting every IoT vendor put an outbound edge device on your shopfloor. The floor stays inbound-only; the attack surface does not grow with every integration.
Watch out for
- !Letting the naming convention drift and re-creating the spaghetti.
- !Spending all energy on new innovation while proven value sits un-deployed.
- !No template or playbook, so each site relearns from scratch.
- !No governance or centre of excellence, so standards erode.
Takeaways
- →Reuse beats reinvention: 60 to 70% of effort goes to scaling what works.
- →Template dashboards and connectors so rollout takes hours, not weeks.
- →Govern the standard, or it will not hold.
Pulling it together
Roughly 80% organisational, 20% technology
The hard part of a UNS is not the broker. It is defining a naming convention that holds, aligning teams across IT and OT, and governing how the namespace evolves.
The roadmap is the same every time
Know the prize, standardise the foundation, fit best-of-breed components, prove value with small pilots, then scale what works.
Cybersecurity stakes rise, not fall
ISA-95, the Purdue model, IEC 62443, ISO 27001 and NIS2 all stay in scope - and matter more as IT and OT converge.
The payoff line
Prove 10% on one line, repeat it across ten, and you have earned a line for free. That is the sentence for your CFO.
Coming soon
Getting-started checklist
All five-phase takeaways on one sheet - a downloadable PDF leave-behind.
Q&A / open discussion
An open working session, not a quiz. A few seed questions to get the room talking.
Q1
What is the biggest challenge now to go to closed loop control?
Q2
Do you have one agreed definition per KPI across sites? Where does it diverge?
Q3
Who owns PLC changes today - is it clean, or do several teams touch them?
Q4
Are you MQTT-only, or do you have transactional needs? How would you know?
Q5
What is one small, repeatable pilot you could run in the next 60 days?
Q6
What would 'show me the money' look like in your organisation, and who signs it off?
Resources
Key sources
- The IT/OT Insider - “The UNS Explained”
- HiveMQ - “What is UNS?” (we do not fully agree with all positions)
- Litmus - “Embracing the UNS Architecture”
- Six Batteries of Change - LQ (official)
- 21st Century Leadership through the Six Batteries of Change - ESTIEM
- Book: De Prins, Letens & Verweire, “Six Batteries of Change”, LannooCampus, 2017.
- Reference standards: ISA-95 / IEC 62264, Purdue model, IEC 62443, ISO 27001 / NIS2.